

Geodjango is basically Django that allows for the mapping and display of spatial data on the web and leaflet.js is a javascript framework that allows developers without a GIS background to very easily display tiled web maps hosted on a public server, with optional tiled overlays. It can load feature data from GeoJSON files, style it and create interactive layers, such as markers with popups when clicked.
Create a virtual environment and install:
- Django
- Psycopg2
- PostgreSQL - we will use it as our database
- Postgis - An extension in PostgreSQL that helps with locational data
- Download leaflet-ajax from this link.
- Django-leaflet using this command:
- Kenya counties shapefile from this link
pip install django-leaflet
START THE DJANGO PROJECT
We will be displaying the county boundaries of a country called Kenya located in East Africa.
django-admin startproject Kenya
Change directory into your Kenya project and create an app called counties
cd Kenya/
python manage.py startapp counties
Using your favorite text editor, open the project. We will use the sublime text editor. Let' make some changes in the settings.py file
On installed apps, add the counties app we created, add leaflet and '
INSTALLED_APPS = [
    'django.contrib.admin',
    'django.contrib.auth',
    'django.contrib.contenttypes',
    'django.contrib.sessions',
    'django.contrib.messages',
    'django.contrib.staticfiles',
    'django.contrib.gis',
    'leaflet',
    'counties',
]
Specify the location of where your templates will be located on the base directory of your project and in a folder called templates.
TEMPLATES = [
    {
        'BACKEND': 'django.template.backends.django.DjangoTemplates',
        'DIRS': [os.path.join(BASE_DIR,'templates')],
        'APP_DIRS': True,
        'OPTIONS': {
            'context_processors': [
                'django.template.context_processors.debug',
                'django.template.context_processors.request',
                'django.contrib.auth.context_processors.auth',
                'django.contrib.messages.context_processors.messages',
            ],
        },
    },
]
The PostgreSQL database provides an extension called PostGIS that enables the storage of spatial data: that is points, lines, and polygons. To use PostgreSQL, specify the engine by using the geospatial(gis) module as shown below, the database name of your choice, the user, the host which in this case will be the localhost as we will be using our machine, your PostgreSQL password and the port on which PostgreSQL was installed.
Ensure you install Psycopg2/Psycopg2-binary so as not to run into Psycopg2 errors. Create the database and ensure the name given on your settings.py is similar to the one you will create on your pgAdmin.
DATABASES = {
    'default': {
        'ENGINE': 'django.contrib.gis.db.backends.postgis',
        'NAME': 'kenya',
        'USER': 'postgres',
        'HOST': 'localhost',
        'PASSWORD': '#',
        'PORT': 5432,
    }
}
Specify the directory in which your static files will be located, that is the javascript, CSS and image files
STATIC_URL = '/static/'
STATICFILES_DIRS = (
    os.path.join(BASE_DIR, 'static'),
)
Configure your leaflet:
- Define a default center, this can be a coordinate of your choice
- Default Zoom: The zoom level the map will always load to
- Minimum zoom: The least level from which one can not zoom in again
- Maximum zoom: The highest level beyond which one can not zoom out again
- Scale: There are three options, imperial which will use miles, metric or both
- Attribution prefix: A preferred statement of your choice or company name
# loading leaflet
LEAFLET_CONFIG = {
  'DEFAULT_CENTER':(-0.26,36.75),
  'DEFAULT_ZOOM':5,
  'MIN_ZOOM':3,
  'MAX_ZOOM': 10,
  'SCALE':'both',
  'ATTRIBUTION_PREFIX':'Powered by Kenya County Govt.',
  }
from django.contrib import admin
from django.urls import path,include

urlpatterns = [
    path('admin/', admin.site.urls),
    path('',include('counties.urls')),
]
Generating GIS Models from spatial data
Download the Kenya counties shapefiles online. Create a folder called data in the root of your project and place the files in the data folder. To work with geospatial data, python provides various libraries such as gdal in our case, we will use ogrinspect to perform layermapping. Layermapping is a class that provides a way to map vector data contents such as shapefiles into the GeoDjango model. Read more about layermapping here
On the terminal, run this command
python manage.py ogrinspect data/Kenya-counties.shp Counties --srid=4326 --mapping --multi
- Specify the path to your shapefile, the file containing the geometry data with the extension(.shp)
- Give a spatial reference ID that will be used when mapping to different platforms, for example, leaflet or OpenLayers. 4326 is used to specify the geographic coordinate system to be used which is WGS 84
- Specify the model name that will be autogenerated
- --mapping will help map the data from the layer to the models in our project
- --mutli will be used to set the geometry field that will be created to multiPolygonField
This will generate the Counties model and a layermapping dictionary with the different fields in the shapefile that will help load the data in the shapefile into the database
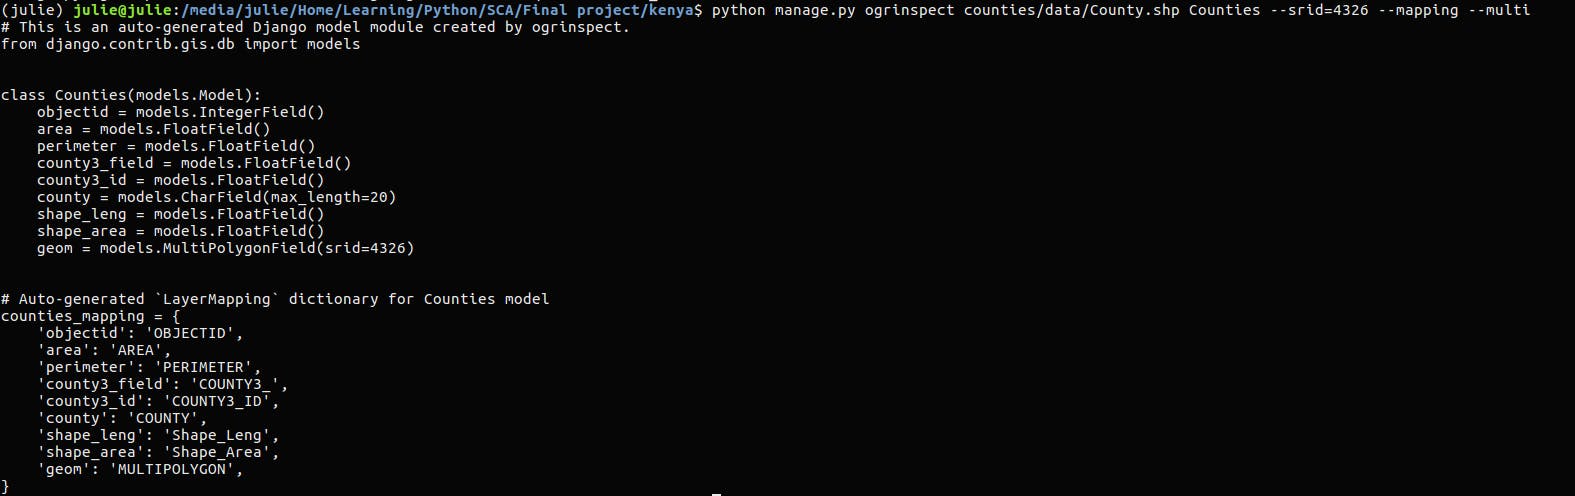
Copy the generated model to your models.py. Create a load.py file in the counties and paste the generated layermapping dictionary
from django.db import models
from django.contrib.gis.db import models

# Create your models here.

class County(models.Model):
    objectid = models.IntegerField()
    area = models.FloatField()
    perimeter = models.FloatField()
    county3_field = models.FloatField()
    county3_id = models.FloatField()
    county = models.CharField(max_length=20)
    shape_leng = models.FloatField()
    shape_area = models.FloatField()
    geom = models.MultiPolygonField(srid=4326)

    def __str__(self):
        return self.county

    class Meta:
        verbose_name='County'
load.py: This file will help us load the spatial data into our database via the terminal
import os
from django.contrib.gis.utils import LayerMapping
from .models import County


county_mapping = {
    'objectid': 'OBJECTID',
    'area': 'AREA',
    'perimeter': 'PERIMETER',
    'county3_field': 'COUNTY3_',
    'county3_id': 'COUNTY3_ID',
    'county': 'COUNTY',
    'shape_leng': 'Shape_Leng',
    'shape_area': 'Shape_Area',
    'geom': 'MULTIPOLYGON',
}

county_shp = os.path.abspath(
    os.path.join(os.path.dirname(__file__), 'data', 'County.shp'),
) # joins the os path to that of the data and stores the loaded data in the county_shp variable

def run(verbose=True):
    lm = LayerMapping(County, county_shp, county_mapping,transform=True,encoding='iso-8859-1',)
    lm.save(strict=True, verbose=verbose)

    # This function merges the County model, mapping aspect and the actual data to load the data into the database
To load the county boundaries into the database, open the python shell
python mange.py shell
from counties import load
load.run()
admin.py: This file registers our model to the admin panel and tells Django which columns of the model to display on the admin panel
from django.contrib import admin
from django.contrib.gis import admin
from .models import *
from leaflet.admin import LeafletGeoAdmin
@admin.register(County)
class CountyAdmin(LeafletGeoAdmin):
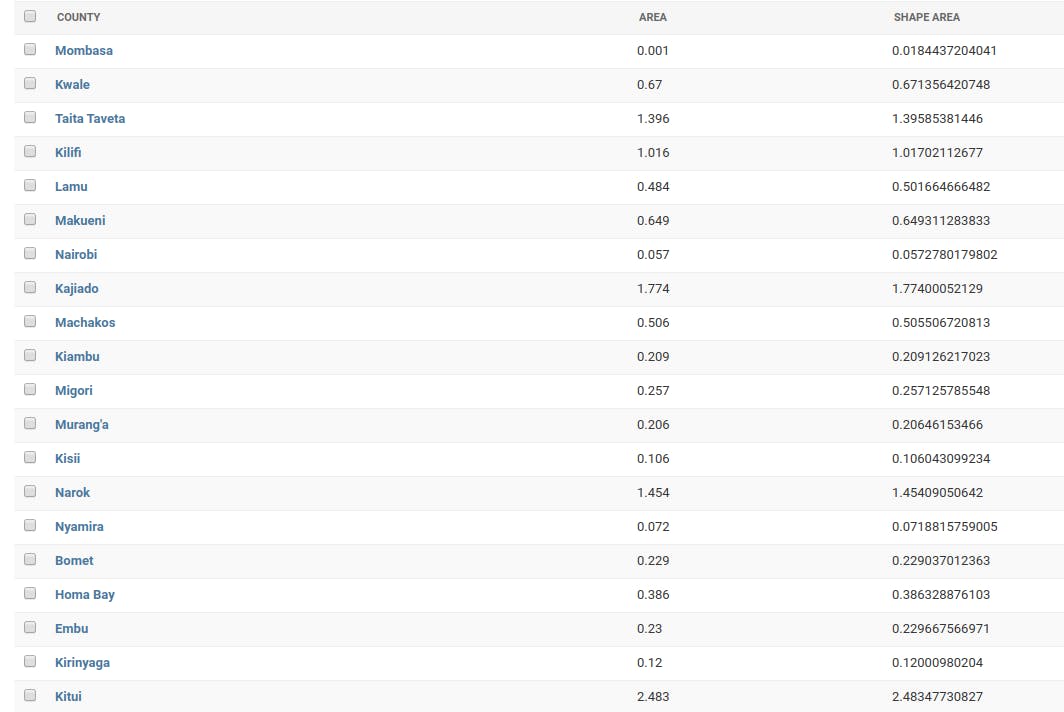
list_display = ('county','area','shape_area')
To view the loaded data, create a superuser and log in to your Django admin portal which will look like this depending on the shapefile data you downloaded from the internet
Preparing our frontend
To load the data to the frontend, we need to serialize the data into GeoJSON format on the views.py and display the coordinates point onto a url 'county'
from django.urls import path
from . import views

urlpatterns = [
    path('',views.homepage_view,name='home'),
    path('county/',views.county_view,name='county'),
]
On our views.py, import the serialize module that will enable us to serialize our data into the GeoJSON format views.py
from django.shortcuts import render
from .models import *
from django.core.serializers import serialize
from django.http import HttpResponse
# Create your views here.
def homepage_view(request):
return render(request,'counties/index.html')
def county_view(request):
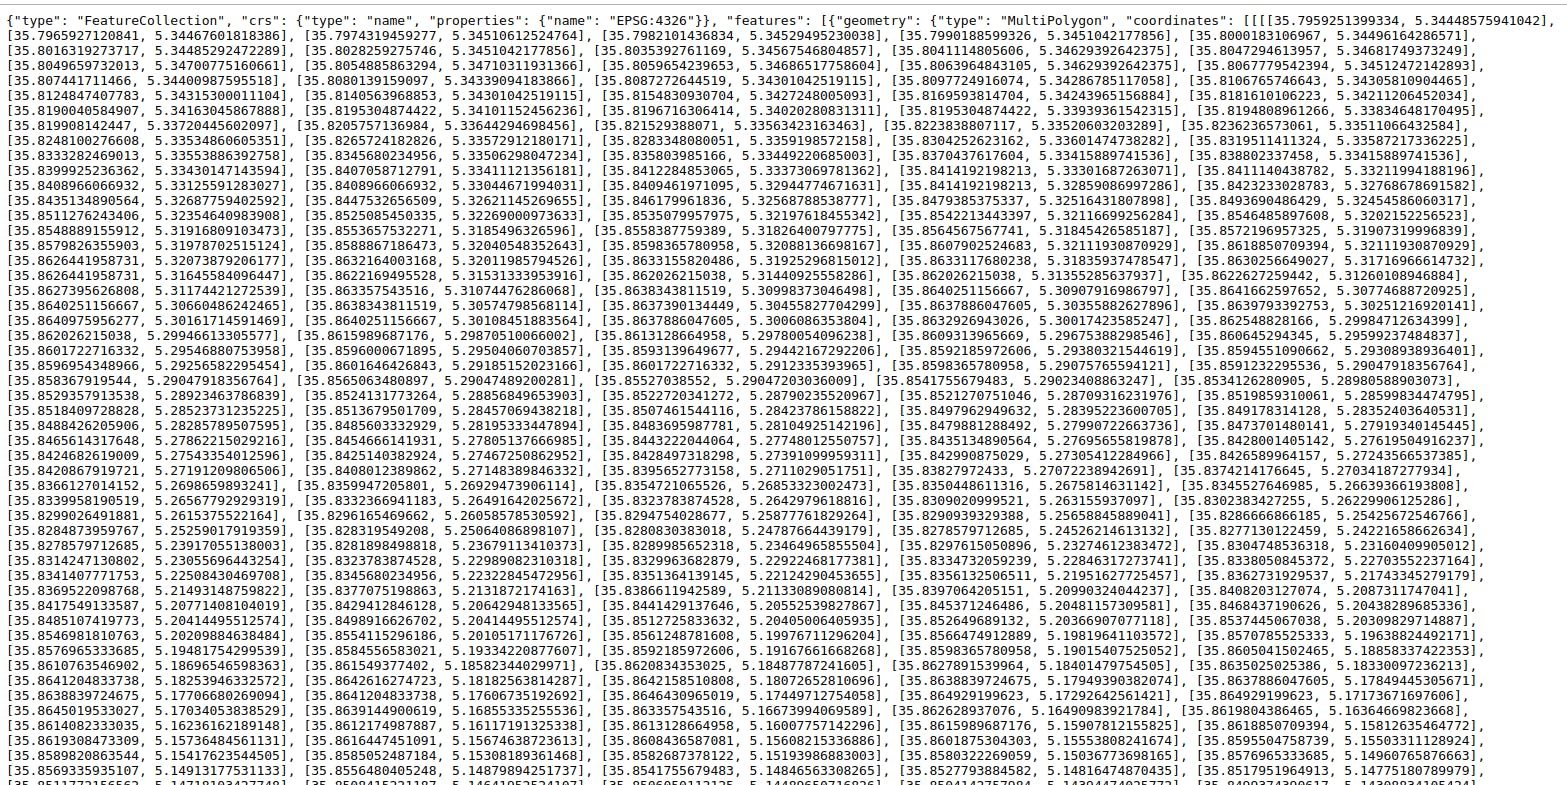
counties=serialize('geojson',County.objects.all())
return HttpResponse(counties, content_type='json')
On the browser, run the county url and an image like the one below should show up on your browser
On your index.html, use the leaflet tags to load the map and write a script to actually show the data on your frontend. Ensure you place the leaflet.ajax.js in your static folder as it helps with the serializing process
{%load leaflet_tags %}
{% leaflet_js %}
{% leaflet_css %}
{% leaflet_map 'kenya' callback="window.map_layer" %}: This loads the map to your homepage and to style it give it an id of your choice, I have given my id as 'kenya'
{%load static %}
<!DOCTYPE html>
<html lang="en">
<link rel="stylesheet" type="text/css" href="{% static 'style.css' %}">
{%load leaflet_tags %}
<head>
{% leaflet_js %}
{% leaflet_css %}
<title>Kenya Counties</title>
<style>
#kenya{
height:500px;
width:100%;
border: solid 1px blue;
}
</style>
</head>
<body>
<div class="country">
<h2>Kenya</h2>
<p>Kenya is a country in East Africa with coastline on the Indian Ocean. It encompasses savannah, Lakelands, the dramatic Great Rift Valley, and mountain highlands. It's also home to wildlife like lions, elephants, and rhinos. From <b>Nairobi</b>, the capital, safaris visit the Maasai Mara Reserve, known for its annual wildebeest migrations, and Amboseli National Park, offering views of Tanzania's 5,895m Mt. Kilimanjaro.</p>
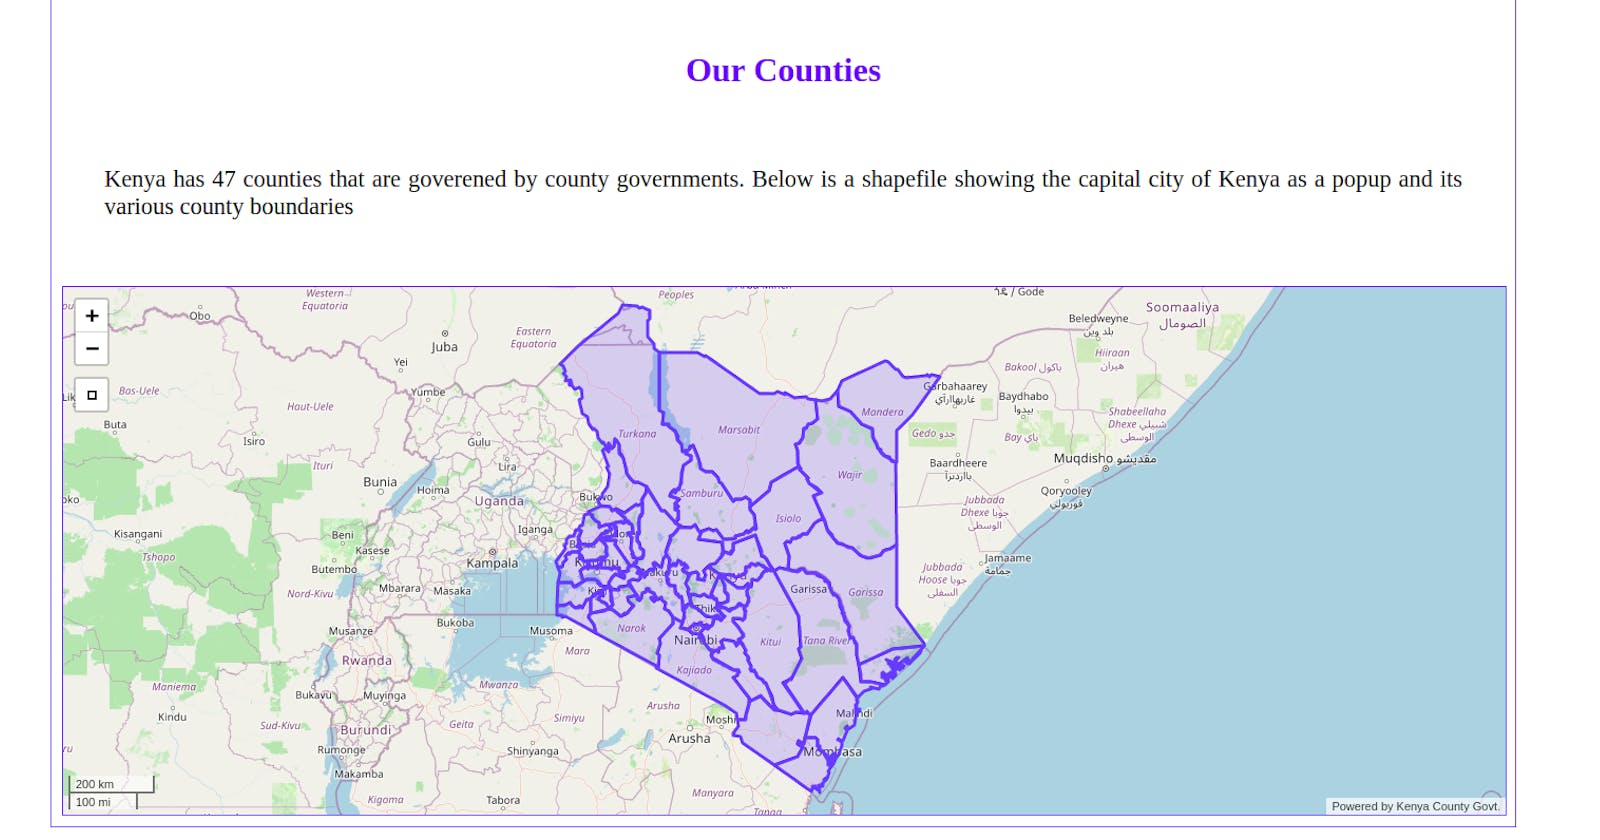
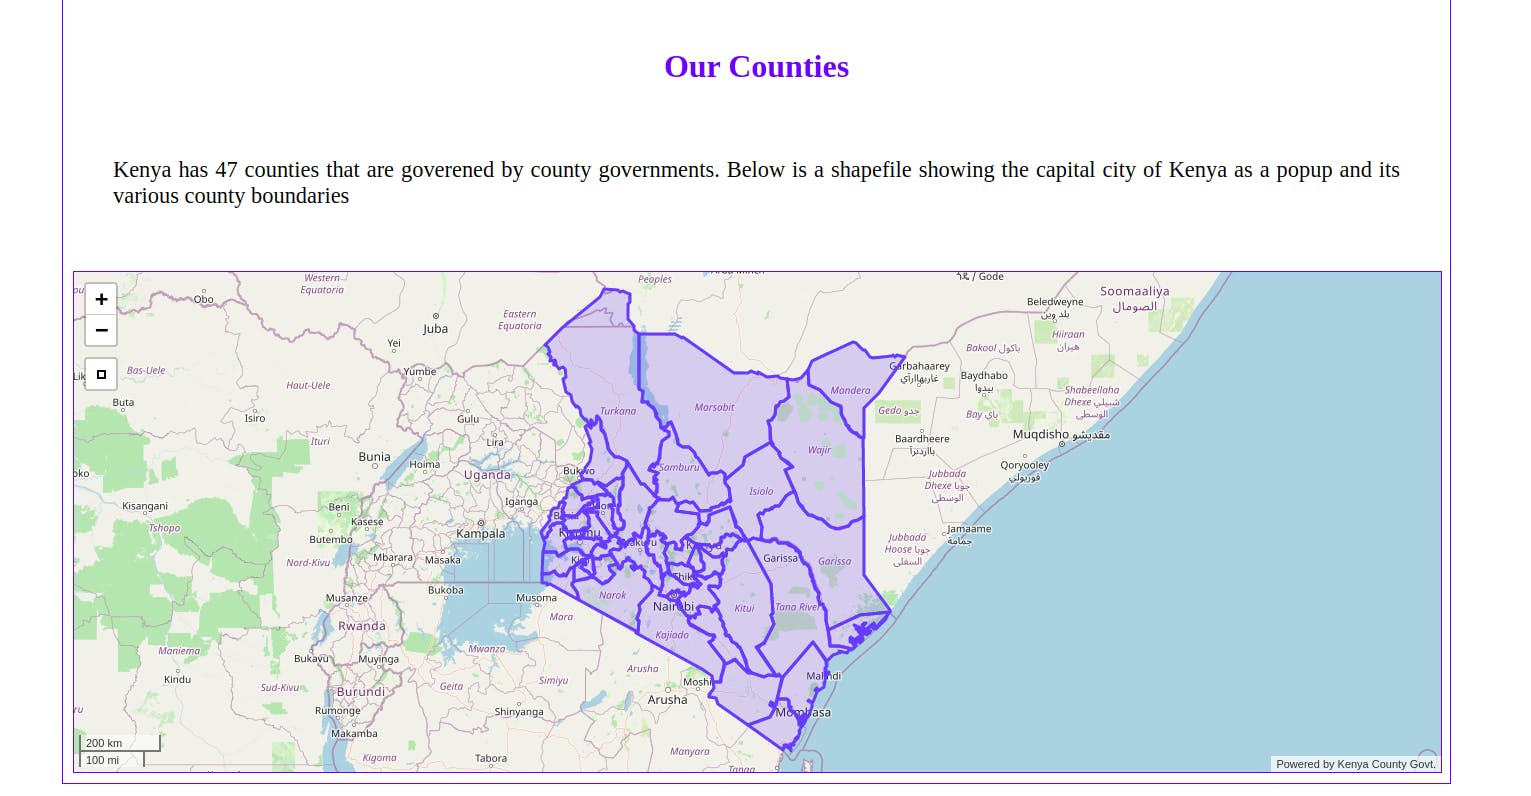
<h3>Our Counties</h3>
<p id='county'>Kenya has 47 counties that are governed by county governments. Below is a shapefile showing the capital city of Kenya as a popup and its various county boundaries</p>
<script type="text/javascript" src="{% static 'dist/leaflet.ajax.js'%}"></script>
<script>
function map_layer(map,options){
var datasets = new L.GeoJSON.AJAX("{% url 'county' %}",{
});
datasets.addTo(map);
}
</script>
{% leaflet_map 'kenya' callback="window.map_layer" %}
</div>
</body>
</html>
Run your server, and you should now see you loaded shapefiles on your homepage as shown below:
There you go, you have been able to create a spatial project on Django. As always, keep learning and keep coding. Cheers!!